Like everything else, annual reports are moving online – and for some very good reasons. From the printed page to the PDF posted online, to reports created for the web or as apps on phones or tablets, a growing number of companies are joining the digital trend.
A recent survey by Savage Brands stated that, while printed annual reports are still as prevalent as digital reports, just 7% of the companies surveyed produced only a print report. Why? Aside from the environmental benefits and cost savings that are a result of not printing and mailing a document, online reports also have much greater flexibility in terms of how they can be presented, distributed and accessed – with multimedia, interactive effects, parallax scrolling and other features offering more possibilities for creativity and ingenuity.
Here are six key features and trends that companies should keep in mind this year as they prepare their annual reports – which should be ready for digitization and online distribution or they’ll risk being left behind.
1. Show, Don’t Tell: The Power of Visuals and Infographics
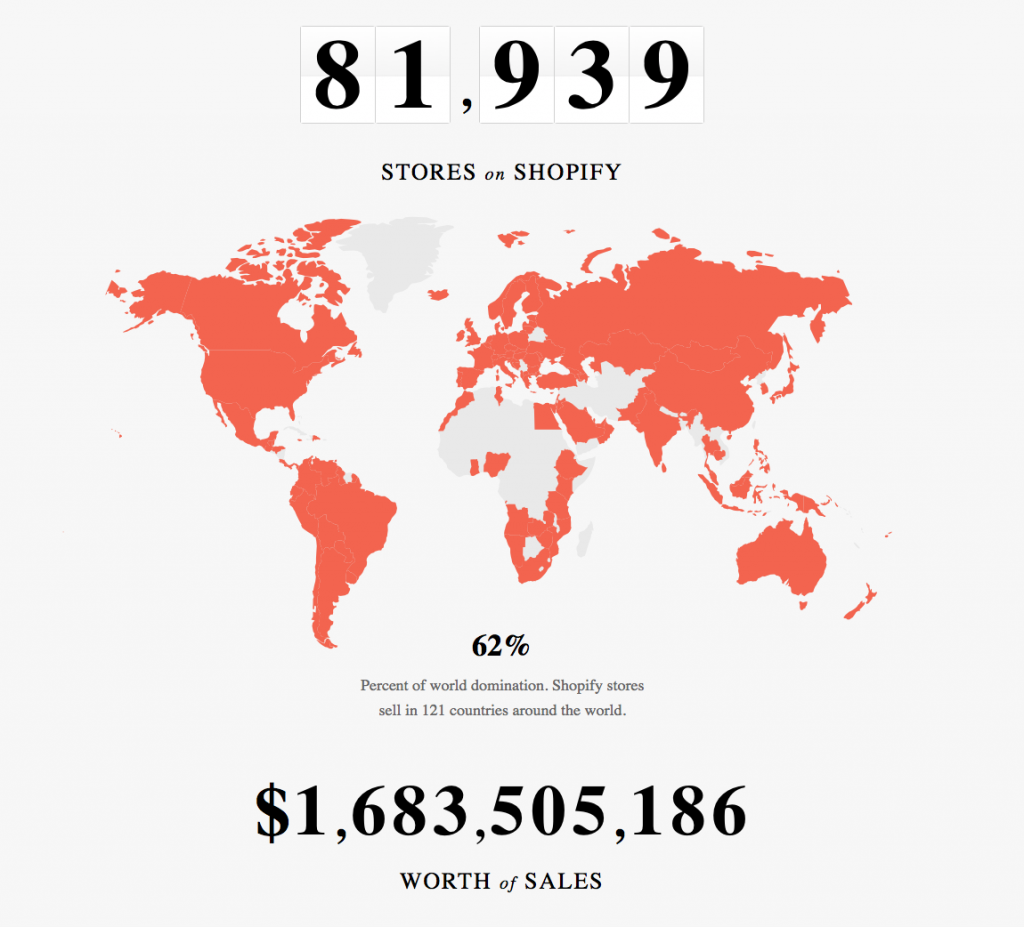
Reading an annual report used to be a chore to endure, with a sense of drudgery rather than anticipation, largely because of the huge volumes of text and tables that readers would have to wade through to find pertinent information. But with many online reports using charts and infographics to essentially show and not tell, this is no longer the case. Plenty of data can be presented in a truncated, concise fashion, which gives the reader an overview of a company’s year in just a few snapshots. An excellent example of this is Shopify, which offers easy-to-read infographics that sum up large amounts of data in bite-sized portions.
2. Leveraging Online-Only Capabilities
Another emerging trend that’s moved to the foreground in the creation of online annual reports is leveraging online-only capabilities. No matter how pretty the graphics or how well-organized the information, printed reports are still essentially static, non-interactive, read-only documents. Digitizing a report and presenting it online goes beyond that, because using web technologies can make things a lot more interesting.
Multimedia videos, sound bites and gifs, notepads, glossaries, parallax scrolling, animations and interactive segments can all play a part in providing a much more engaging experience.
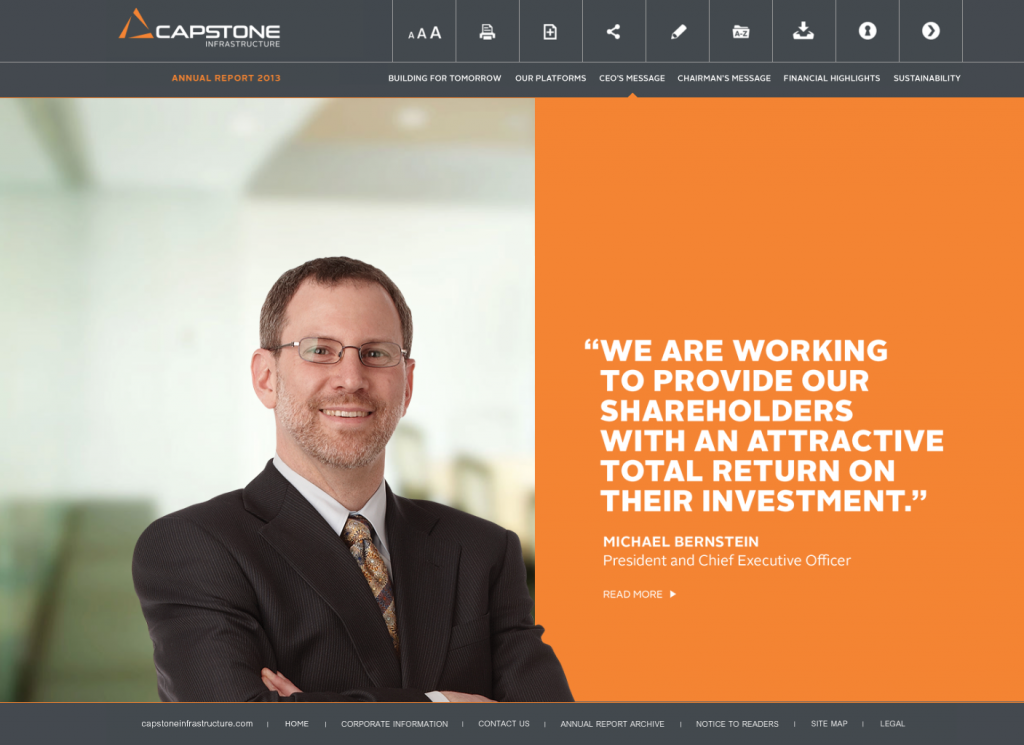
Check out this great animated scrolling effect in Capstone Infrastructure’s latest annual report, which brings the data to life in a way that simply isn’t possible in a print-only format (It also uses infographics to great effect).
3. Professionalism Meets Playfulness
A company’s annual report must give a summary of its financial and operating performance over the previous year, with a review of accomplishments, disappointments, significant events, priorities and strategies. And clearly, this must all be presented with a high level of professionalism and stuffiness.
Except, not really.
With the internet in the mix, this is quickly changing. As it turns out, adding a spoonful of playfulness makes year-end data easier to digest and can entice more readers to make their way through all of it. Functionally, the report still needs to get the job done, but that doesn’t have to involve all work and no play.
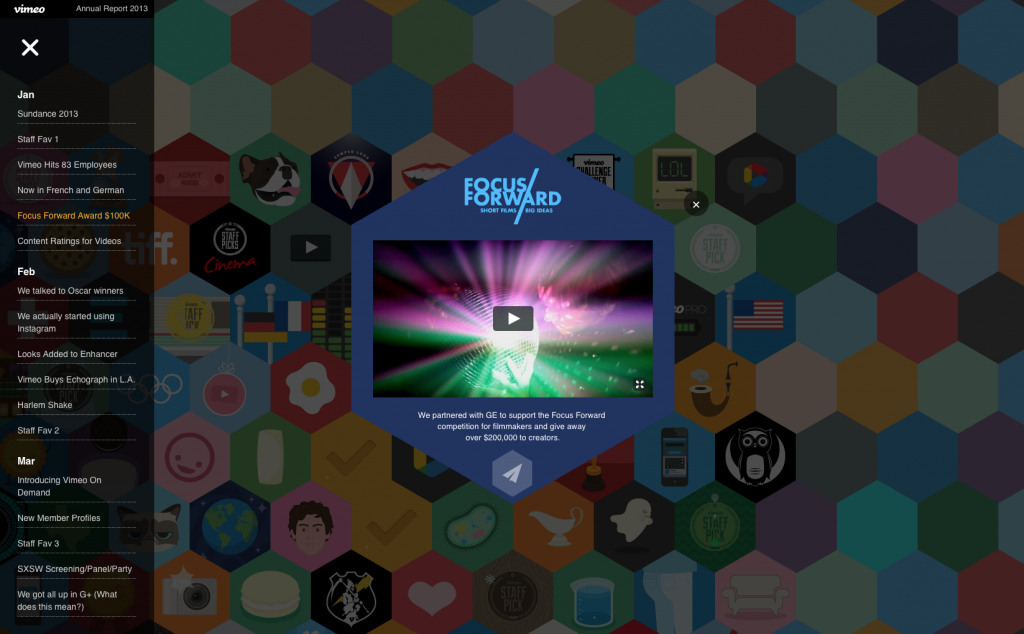
Check out vimeo’s 2013 report, a prime example of the interplay between functionality and fun. It gets all of the important points across, but it does so in a way that entices but doesn’t overwhelm the reader.
4. Summarized – and Detailed – Information
There are many readers of a company’s annual report: stockholders, employees and consumers, as well as a general readership. However, they don’t all want to read everything about the company. Some may only be interested in information pertaining to their relationship with the organization. With web technologies, it’s now possible to parse the information that’s available in a report for easier access.
The use of headings and links that summarize key types of information – but don’t present the details in full until clicked – is a good way to guarantee that the readers of an annual report won’t be bombarded with information they don’t want. This ensures readers can select only the information that interests them, while all key summary points are still presented in the form of headings or modules.
RBC’s annual report is a good example of this approach, with a summary list of headings and callouts that identify its successes and accomplishments, including its earnings for the year, its commitment to social responsibility and its stature as one of the largest banks in the world, each of which, when clicked (and only when clicked) gives all of the related details.
5. Flat, clean design
Clean, flat, minimalist and generally well-designed annual reports are becoming the industry standard. The annual reports that make it to the top 10 lists and are the most effective at conveying their message are also the ones that look good. It’s not only the information within them that matters, or the bells and whistles, like animations, videos or parallax effects, it’s the overall visual presentation.
Any of the previous examples in this article are a testament to this, but Kickstarter’s 2013 report makes the point as well. Simple, understood-at-a-glance callouts summarizing key points, minimalist looping background videos and a flat, two-tone style all make this annual report both effective and pleasing to read. Take note.
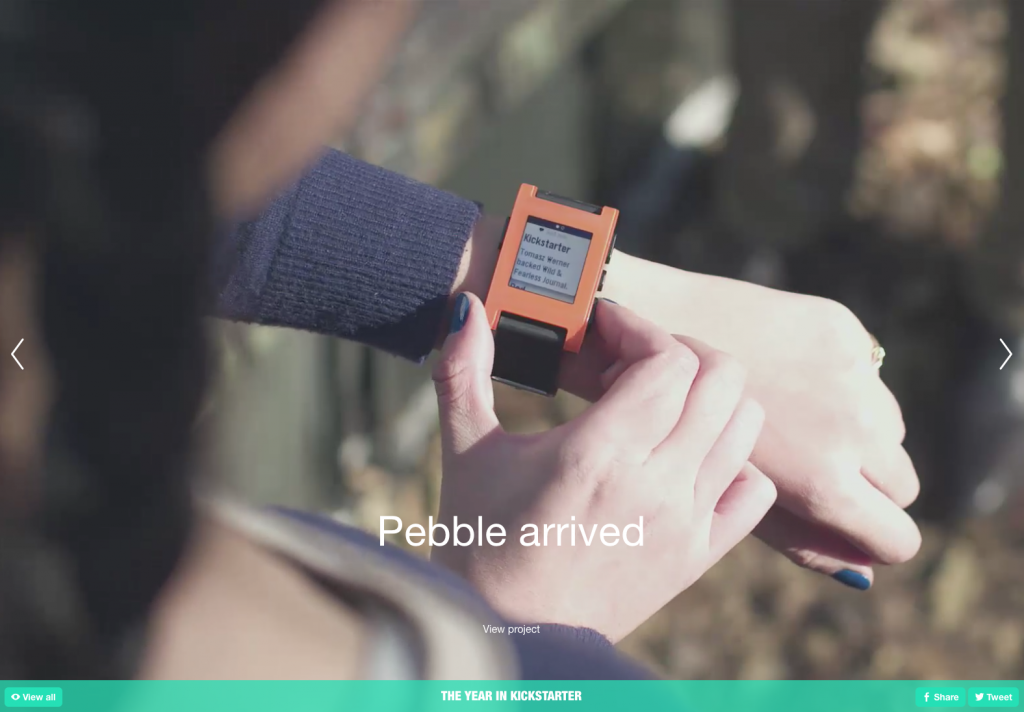
Simple, understood-at-a-glance blurbs summarizing key points, minimalist looping background videos, and a flat, two-coloured style makes both an effective and pleasing to read annual report. Take notes.
6. Content-Driven Apps for Offline Access
Moving a company’s annual report online is less about digitizing the information and more about how it’s presented. It’s no longer enough to post a PDF online, or to create a microsite for the report. These days, the annual reports of leading companies are evolving into robust and innovative content-driven mobile apps.
A fully interactive app experience is content-rich and user-focused, and can engage readers in a full native app experience that is accessible without an internet connection. The app option ensures that the same rich online experience is available to shareholders, employees and everyone else interested in a company’s annual report.
